Nov 2015
Interactive Facebook Graph Visualization
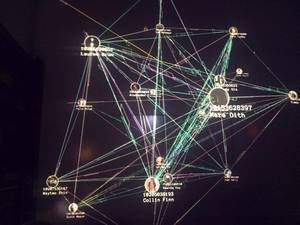
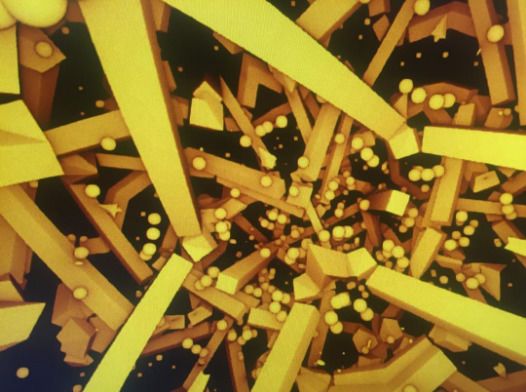
this._node at EAST from ByMeredith on Vimeo.
A collaboration with Tom Bandage.
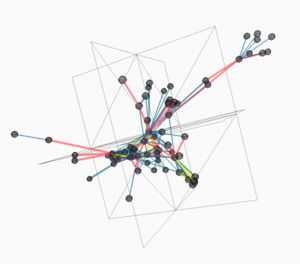
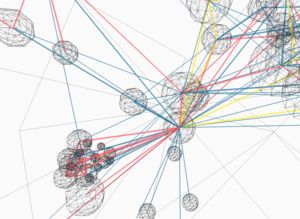
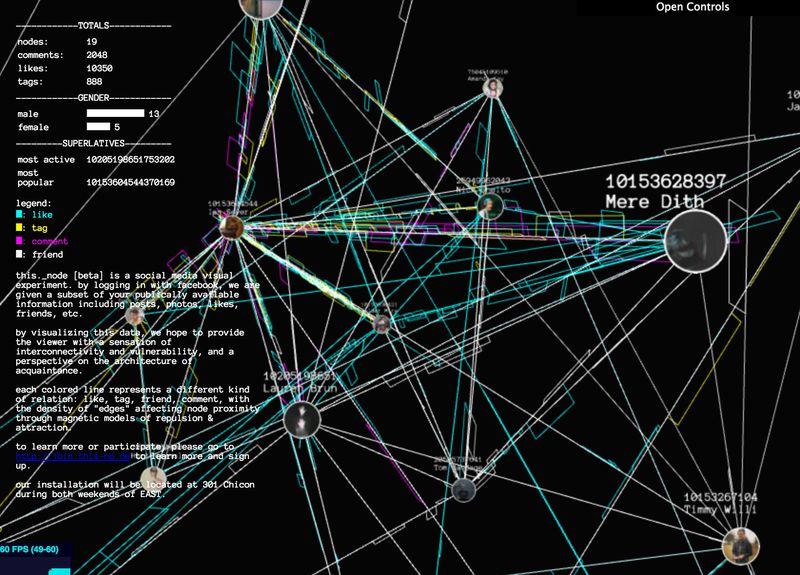
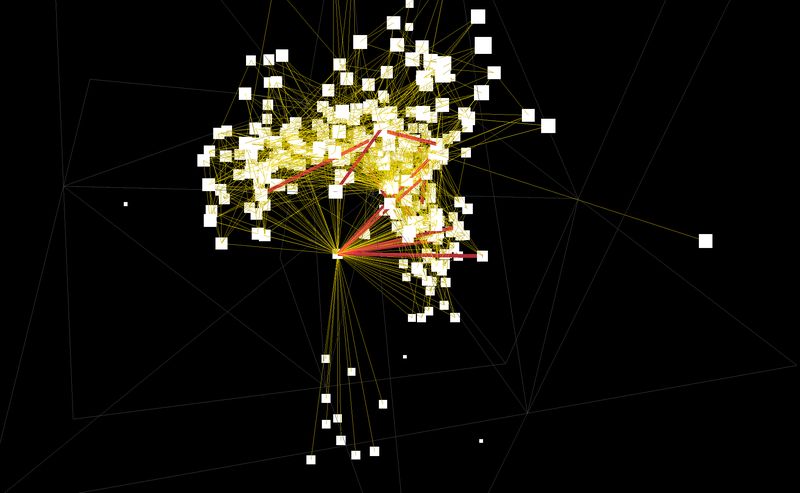
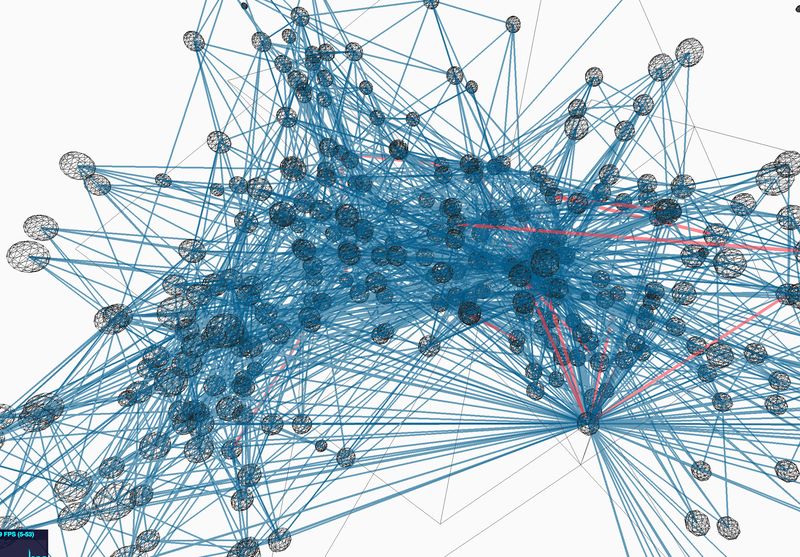
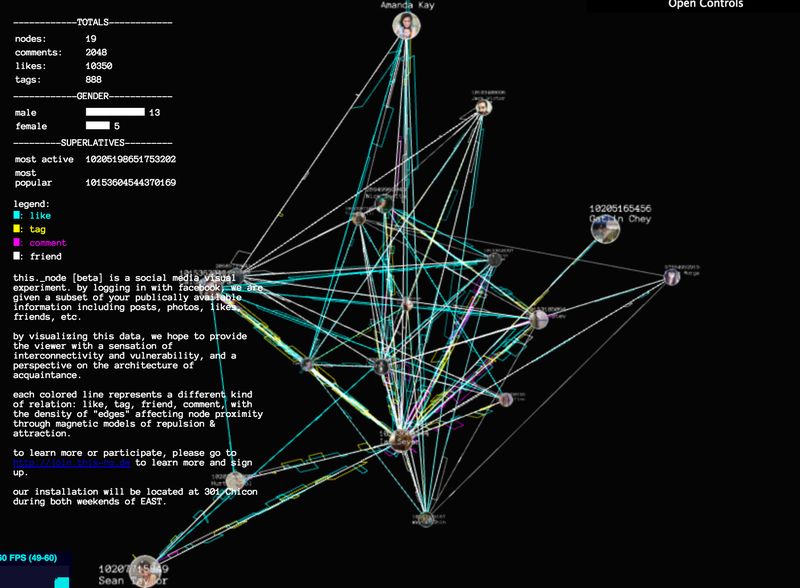
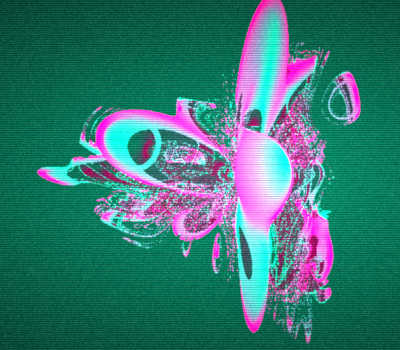
Users log in on the website, and their connections are displayed in the space. I implemented a custom THREE.js 3D graph renderer, using a force-directed layout [source]. Every line represents a single like, comment or photo tag shared between the two users. The 3D Structure spins slowly and responds to new users being added.
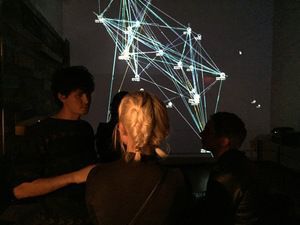
Featured at East Austin Studio Tour